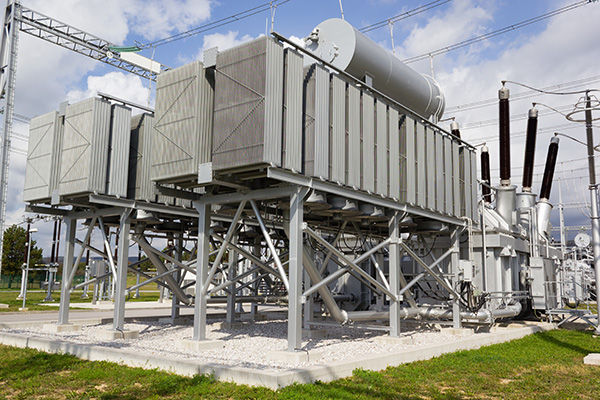
Planning transmission network investments in an uncertain world

March 22, 2023

The scale of the challenge to deliver net zero networks globally is huge. Some transmission reinforcement options (such as new transmission lines) have a clear future need and a high net present value—and should be progressed as soon as possible. However, there are many others where the future need is highly uncertain. Reinforcement options that can be adapted over time based on how the network evolves are critically important but not always fairly considered in network planning. So how do you value this flexibility? Conventional static net present value (NPV) analysis may undervalue it, biasing decisions in favour of inflexible options. As our General Manager of Europe Hedd Roberts explains, real options analysis can be used to provide an objective approach to valuing flexibility leading to decisions that provide better outcomes for consumers.

Renewable energy being generated today is often wasted because the grid – as it currently stands – is congested and cannot take any more. While new transmission lines are certainly needed to expand electricity systems, it may take years to build out and is very capital-intensive. Technologies that utilize the spare transmission capacity that exists can usually be delivered much more quickly and therefore have an important role to play in making the grid more efficient.

But there are different technologies which can be applied to utilize this spare capacity, and although there can be only marginal differences between their costs, they deliver very different levels of flexibility.  When there is high uncertainty regarding future need and a relatively marginal investment decision, it is crucial that flexibility is valued to achieve the right decision. Ultimately consumers foot the bill, and choosing the wrong network investment option can be very costly.

So, how can flexibility be objectively valued?

This article presents an example application of ‘real options’ analysis using a case where power flow control technology is needed to resolve congestion on a 275 kV network. This example draws on cases previously set out by electricity regulators in the UK (Ofgem), Australia (AER), and the electricity market regulator in New Zealand (EC).

The need

This use case is based on the need to improve circuit power sharing on a 275 kV network using power flow control technology. This would reduce congestion on the network without building new transmission lines, and result in cost savings due to avoided congestion costs and lower capital costs. 

Scenario analysis is used to understand the key drivers of value and risk in the investment.  The scenarios are based on expert judgement and can incorporate a wide range of factors.  Here, three scenarios have been developed to better understand the range of future generation and demand connections on part of the 275kV network and therefore the level of congestion costs that would be experienced with no investment.  The scenarios are described below:

Assumes very little new renewables development in the exporting part of the 275kV network, and therefore no congestion costs.

Assumes new renewables development in the exporting part of the 275kV network, but also some increase in demand as a result of the decarbonisation of heat, transport and industry. Congestion costs without reinforcement would increase from $0 M in 2023 and 2024 to $1.90 M per year from 2025 to 2030. The net present cost of this congestion is $10 M¹.

[1] Based on a discount rate of 3%

Assumes significant new renewables development in the exporting part of the 275kV network with no increase in demand. Congestion costs without reinforcement would increase from $0 M in 2023 and 2024 to $1.90 M per year in 2025 and 2026 and then again to $4.84 M per year from 2027 to 2030. The net present cost of this congestion is $20 M¹.

[1] Based on a discount rate of 3%

The options

We compared two principal power flow control technologies—Phase Shifting Transformer (PST) [or a Quadrature Booster (QB)] and modular Static Synchronous Series Compensators (SSSC)—to find the optimal solution, using the real options approach.

Both technologies have been primarily used for power flow control to date, but m-SSSC devices can also provide dynamic services such as improving transient stability.

PST

750 MVA Phase Shifting Transformer with a maximum phase angle of 12° PSTs are custom-built for each application so typically have a longer lead time and installation period than comparable power flow control technologies. PSTs can’t be easily expanded, so the full solution needs to be built on day one.
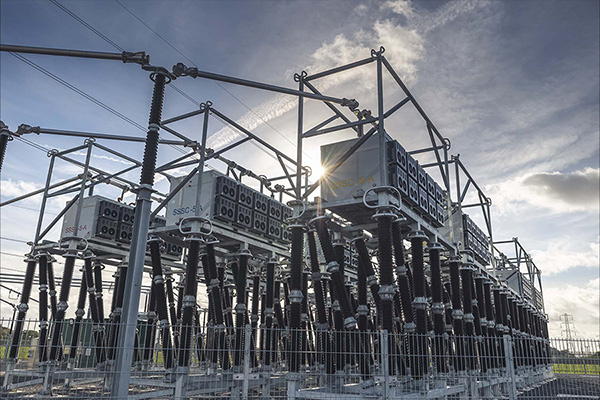
m-SSSC Devices

Modular SSSC devices, where the number of devices can be adapted based on which scenario evolves. The modular nature of m-SSSC devices means that they provide a flexible and scalable solution. M-SSSC devices can typically be delivered faster than alternative power flow control technologies, allowing transmission owners to take a “wait and see” approach.

Cost: $10M

The total investment is fixed as the PST’s installed cost ($10 M), as the PST cannot be partially installed. However by installing the full solution from the outset, there are economies of scale resulting in a cost saving.

Cost: $5.25M – partial deployment, to achieve the equivalent of a 6° phase angle
OR
Cost: $10.5 M – full deployment, the original devices plus more devices added at later date to achieve the equivalent of a 12° phase angle overall

The total investment is variable, depending on how the network need evolves over time. If the reality is close to Scenario 2, then the partial deployment will resolve congestion with an installed cost of $5.4 M. If the reality is closer to Scenario 3, then the deployment can be scaled up to the full deployment for an additional $5.4 M.

Explanation of cost 

The actual costs for the PST and the modular SSSC devices will depend on a number of site and application specific factors.  To keep this use case as simple as possible, a cost of $10 M has been assumed for the PST.  In order to demonstrate the advantages of a real options analysis, it has also been assumed for this use case that there are economies of scale associated with the PST when compared to the fully scaled up modular SSSC deployment (with the number of devices required to achieve the equivalent of a 12o phase angle).  To reflect this, the cost of the full modular SSSC deployment has been increased by 5% to $10.5 M.

So what would you do in each scenario? 

PST

Take decision to install PST in 2023 due to the forecast of future congestion costs

Cost: $ 10 M
Benefit: $ 0 M
Net Present Value = ($10 M)

m-SSSC

Take decision to install partial m-SSSC deployment in 2023 due to the forecast of future congestion costs. Under these circumstances where the forecast congestion does not then arise, the m-SSSC devices could be redeployed to another part of the network, but this option has been ignored in the interests of simplicity.

Cost: $5.25 M
Benefit: $ 0 M
Net Present Value = ($5.25 M)

PST

Take decision to install PST in 2023 due to the forecast of future congestion costs

Cost = $ 10 M
Benefit = $ 10 M
Net Present Value = $0m

m-SSSC

Take decision to install partial m-SSSC deployment in 2023 due to forecast of future congestion costs

Cost = $5.25 M
Benefit = $ 10 M
Net Present Value = $ 4.75 M

PST

Take decision to install PST in 2023 due to the forecast of future congestion costs

Cost = $ 10 M
Benefit = $ 20 M
Net Present Value = $ 10 M

m-SSSC

Take decision to install partial m-SSSC deployment in 2023 due to forecast of future congestion costs. Take decision to move to full m-SSSC deployment in 2025 due to indication that constraint costs will increase further.


Cost = $5.25 M + $4.95 M² = $ 10.2 M
Benefit = $ 20 M
Net Present Value = $ 9.8 M

[2] $5.25M in 2025 has a net present cost of $4.95 M based on a cost of capital of 3%

The benefits

If the scenarios are deemed to be equally likely, then the risk-adjusted Net Present Values for the two options are:

$0 M

The cost of the PST is the same as the consolidated risk-adjusted Present Value, so the risk-adjusted Net Present Value is nil.

The calculation is as follow: (-$10 M + $0 M + $10 M)/3 

$3.1 M

While the economies of scale associated with the PST offer a marginal cost advantage over the full deployment m-SSSC in Scenario 3, the flexibility of the m-SSSC solution provides significant advantages in Scenarios 1 and 2 such that the risk-adjusted Net Present Value is significantly higher. It should be noted that this is the case even though we are ignoring the potential to re-deploy the m-SSSC devices under Scenario 1.

The calculation is as follows: (-$5.25 M + $4.75 M + $9.8 M)/3 

To keep it simple, the lead-time associated with each network option is assumed to be the same in this example.  However, m-SSSCs typically have shorter lead times, which provides even greater flexibility to the network owner to adjust the m-SSSC deployment to the actual network conditions.

This simplified example demonstrates the advantages of real options analysis in valuing the flexibility associated with options.  A more traditional static DCF or NPV analysis would likely focus on minimising regret and therefore only consider Scenario 3 (where future congestion and therefore potential regret is the highest), leading to a preference for the PST due to the marginal cost saving.  This example shows how fairly valuing flexibility across all scenarios can lead to a different result when comparing network options, and ultimately deliver a better outcome for consumers.

Since this is a simplified example of the trade-off, it could be extended to consider a larger number of periods, a more sophisticated treatment of the uncertainty with regard to future congestion costs and a greater number of options for the number of modular SSSC devices.

Making the right network investment decisions is critical in our journey to net zero and to keeping costs for consumers affordable. Adopting the real options approach enables the transmission owner to evaluate multiple network options across all scenarios, and choose the optimal option for both the network and society as a whole.

Contributing expert

Hedd Roberts

General Manager, Europe

Hedd Roberts has been General Manager – Europe at Smart Wires since early 2022, working with customers across Europe to address their challenges with Smart Wires products and capabilities.  Prior to that, he worked for National Grid in the UK in various senior roles covering regulation, customer connections, system development, investment management and the development of access and charging arrangements.